


Does making good business decisions become more complex and confusing as your company grows? As you bring more leaders and stakeholders into the process and the channels of communication begin to multiply – it’s important that you can clear through the cloud of confusion, see what’s really going on inside your organization at every level, and communicate clearly with your team.
As we continue to discuss how a systems-based partnership can help ease the growth pains of operational complexity, let’s highlight some specific tooling your Account Manager may recommend.
Using data visualization to gain clarity, quickly.
Data visualization provides better insight into the health of your business. Think of it like a heart rate monitor – showing if the pulse is steady and strong or if the metaphorical defibrillator needs to be brought in. You can create reports and dashboards that show the specific Key Performance Indicators (KPIs) of your choosing, so you know what's going on in your business at any time.
With our EBMS SQL Mirror module and a business intelligence tool like Microsoft Power BI, your data can be sliced, diced, and displayed in ways that are meaningful to you and your team.
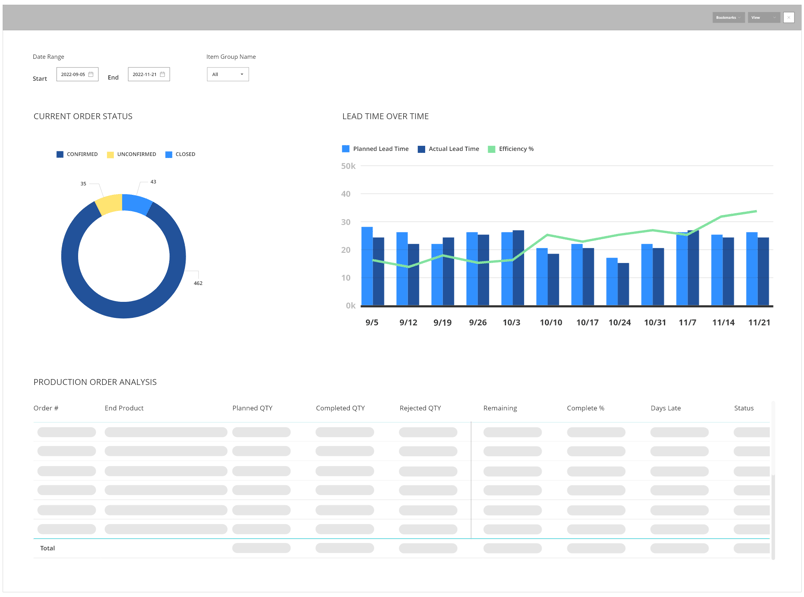
Once you have everything set up, you can customize your dashboards and reports to show you exactly what you need – from anywhere. The KPIs and trends you choose to track are specific to your business processes and goals. Anything from sales per hour to ticket backlogs to works in progress - if the data is stored in EBMS, it can be mirrored to the SQL server and shown on a dashboard for everyone to see.
These reports and dashboards can help you communicate with stakeholders more easily.
We know that we need to communicate our overall business goals with our stakeholders to keep everyone focused and things moving forward. Giving your stakeholders the ability to see the trends and KPIs that affect those goals - updated in real-time - can be a game changer in achieving those goals.

If your production manager can’t see that the ETA of a product has changed, he may not know that he needs to change tomorrow’s production schedule, and the salesperson won’t know that the order won’t be completed on time. When you have a monitor on the production floor with dashboards displaying the most relevant data, everyone gets the information they need at a glance.
"The thing that excited me most since getting EBMS is the Power BI reports that are extremely flexible and visual. They have enabled us to create multiple dashboards to monitor every aspect of this business.
There's been many times where we needed to track a certain number or trend to see what's going on, so I usually make a Power BI dashboard - it takes 20 minutes, and then we have it there for everybody to see."- Henry Zook, Millcreek Manufacturing
When the people that are supporting your key processes have the latest information at their fingertips, they can make well-informed decisions in a timely manner.
You can also set up alerts so that your stakeholders get notifications when important KPIs reach certain levels.
If certain trends are dipping towards critical levels or you’re overproducing materials, your stakeholders can be notified immediately, allowing them to respond accordingly. When you have so much going on, having the tools to set up triggers like these is the most efficient way to communicate important information quickly
Takeaway:
Setting up your operational teams and stakeholders with data visualization tools gives them the resources they need to make informed decisions quickly, improving how your company shares information across multiple channels of communication and overcoming this common growth barrier.
If you think your stakeholders would be able to make better decisions in day-to-day operations with data visualization tools, talk to your Account Manager about the EBMS SQL Mirror. Gain the clarity you need to make informed decisions, communicate well, and build a better business.
Additional Resources
- Scaling Past Small Business Growth Barriers, pt. 1 | On the Blog
- Scaling Past Small Business Growth Barriers, pt 2 | On the Blog
- The Stories Your Data Tells | EBMS Insider
- SQL Mirror in EBMS